Graduation Rate and Transfer-Out Data
Under the U.S. Department of Education regulations, every college and university is required to disclose graduation rates and transfer rates. Below is a chart listing the total number of students who began their enrollment in the Fall of 2020. These first-time, full-time students either completed degrees, transferred to other institutions, or withdrew from the college in the last four years. Info is available by calling Institutional Research at (618) 468-4300. This report is presented as consumer information.
| Student Group | First-Time Full-Time Degree- or Certificate-Seeking Students | Completed in less than 2 Years | Completed in 2-4 Years | Still Enrolled | Transferred Out | Others |
|---|---|---|---|---|---|---|
| All Illinois Students | 23,761 | 6.40% | 31.10% | 10.20% | 19.80% | 32.50% |
| All LC Students | 433 | 11.80% | 36.00% | 7.40% | 17.80% | 27.00% |
| LC White | 348 | 12.90% | 36.20% | 8.00% | 15.80% | 27.00% |
| LC Black/African-American | 24 | -- | 16.70% | -- | 20.80% | 45.80% |
| LC Hispanic/Latino | 19 | -- | 26.30% | -- | 47.40% | 15.80% |
| LC Asian | 4 | -- | -- | -- | -- | -- |
| LC Native Hawaiian/Pacific Islander | 0 | -- | -- | -- | -- | -- |
| LC Multi-Racial | 12 | -- | 41.70% | -- | -- | -- |
| LC Unknown Race/Ethnicity | 26 | -- | 53.80% | -- | 15.40% | 23.10% |
| LC U.S. Nonresident | 0 | -- | -- | -- | -- | -- |
| LC Female | 226 | 10.20% | 38.10% | 9.30% | 15.90% | 26.50% |
| LC Male | 207 | 13.50% | 33.80% | 5.30% | 19.80% | 27.50% |
| LC Student Athletes | 34 | -- | 50.00% | 0.00% | 38.20% | -- |
| LC Basketball | 8 | -- | -- | -- | 50.00% | -- |
| LC Baseball | 9 | -- | 55.60% | -- | 44.40% | -- |
| LC Any Other Sport | 17 | -- | 58.80% | -- | 29.40% | -- |
| LC Scholarship Athletes of Color | 10 | -- | 30.00% | -- | 40.00% | -- |
| LC White Scholarship Athletes | 21 | -- | 61.90% | -- | 33.30% | -- |
| LC Scholarship Athletes of Unknown Race | 3 | -- | -- | -- | -- | -- |
| LC Female Scholarship Athletes | 16 | -- | 50.00% | -- | 37.50% | -- |
| LC Male Scholarship Athletes | 18 | -- | 50.00% | -- | 38.90% | -- |
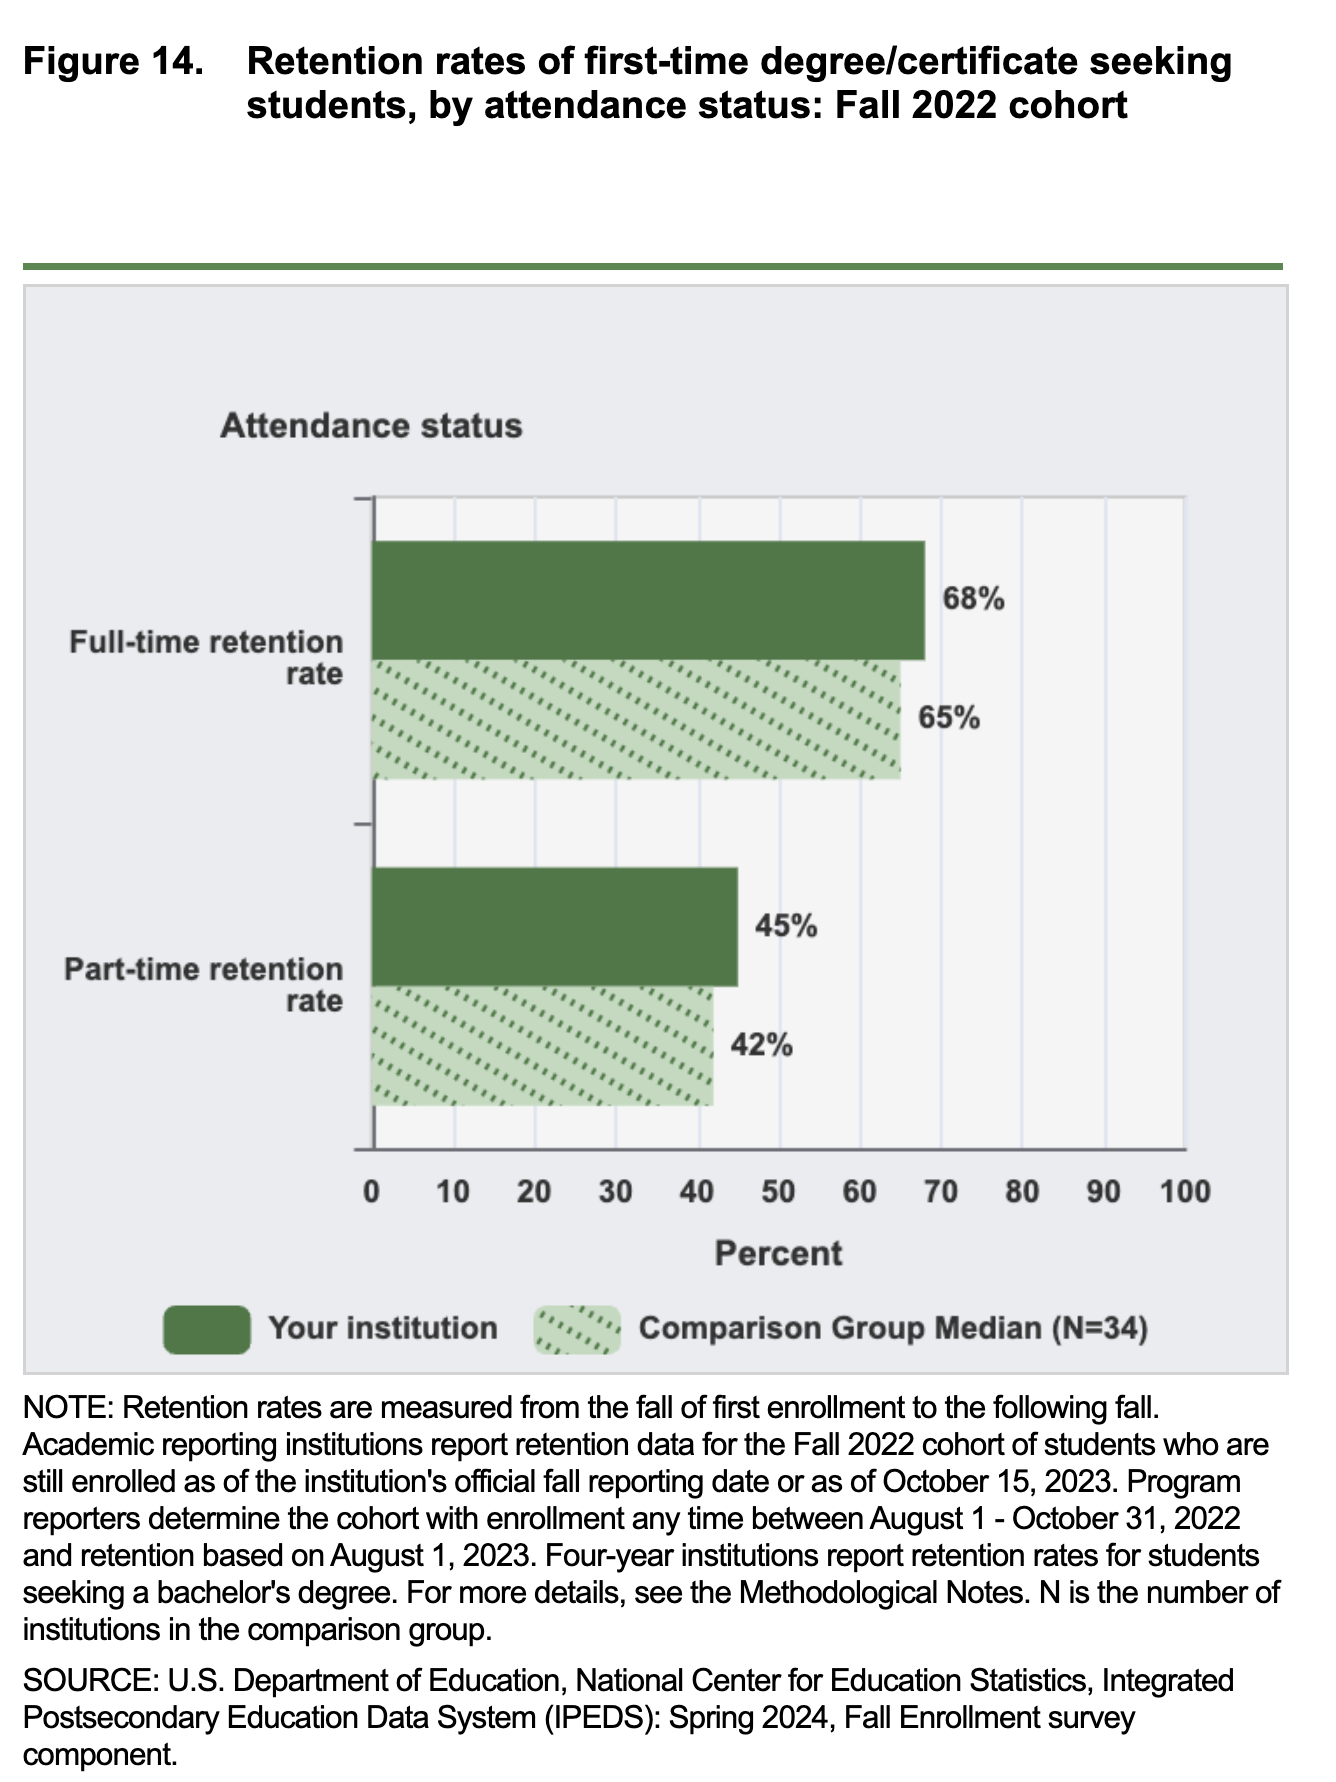
Retention Rates
Postsecondary Education Outcomes
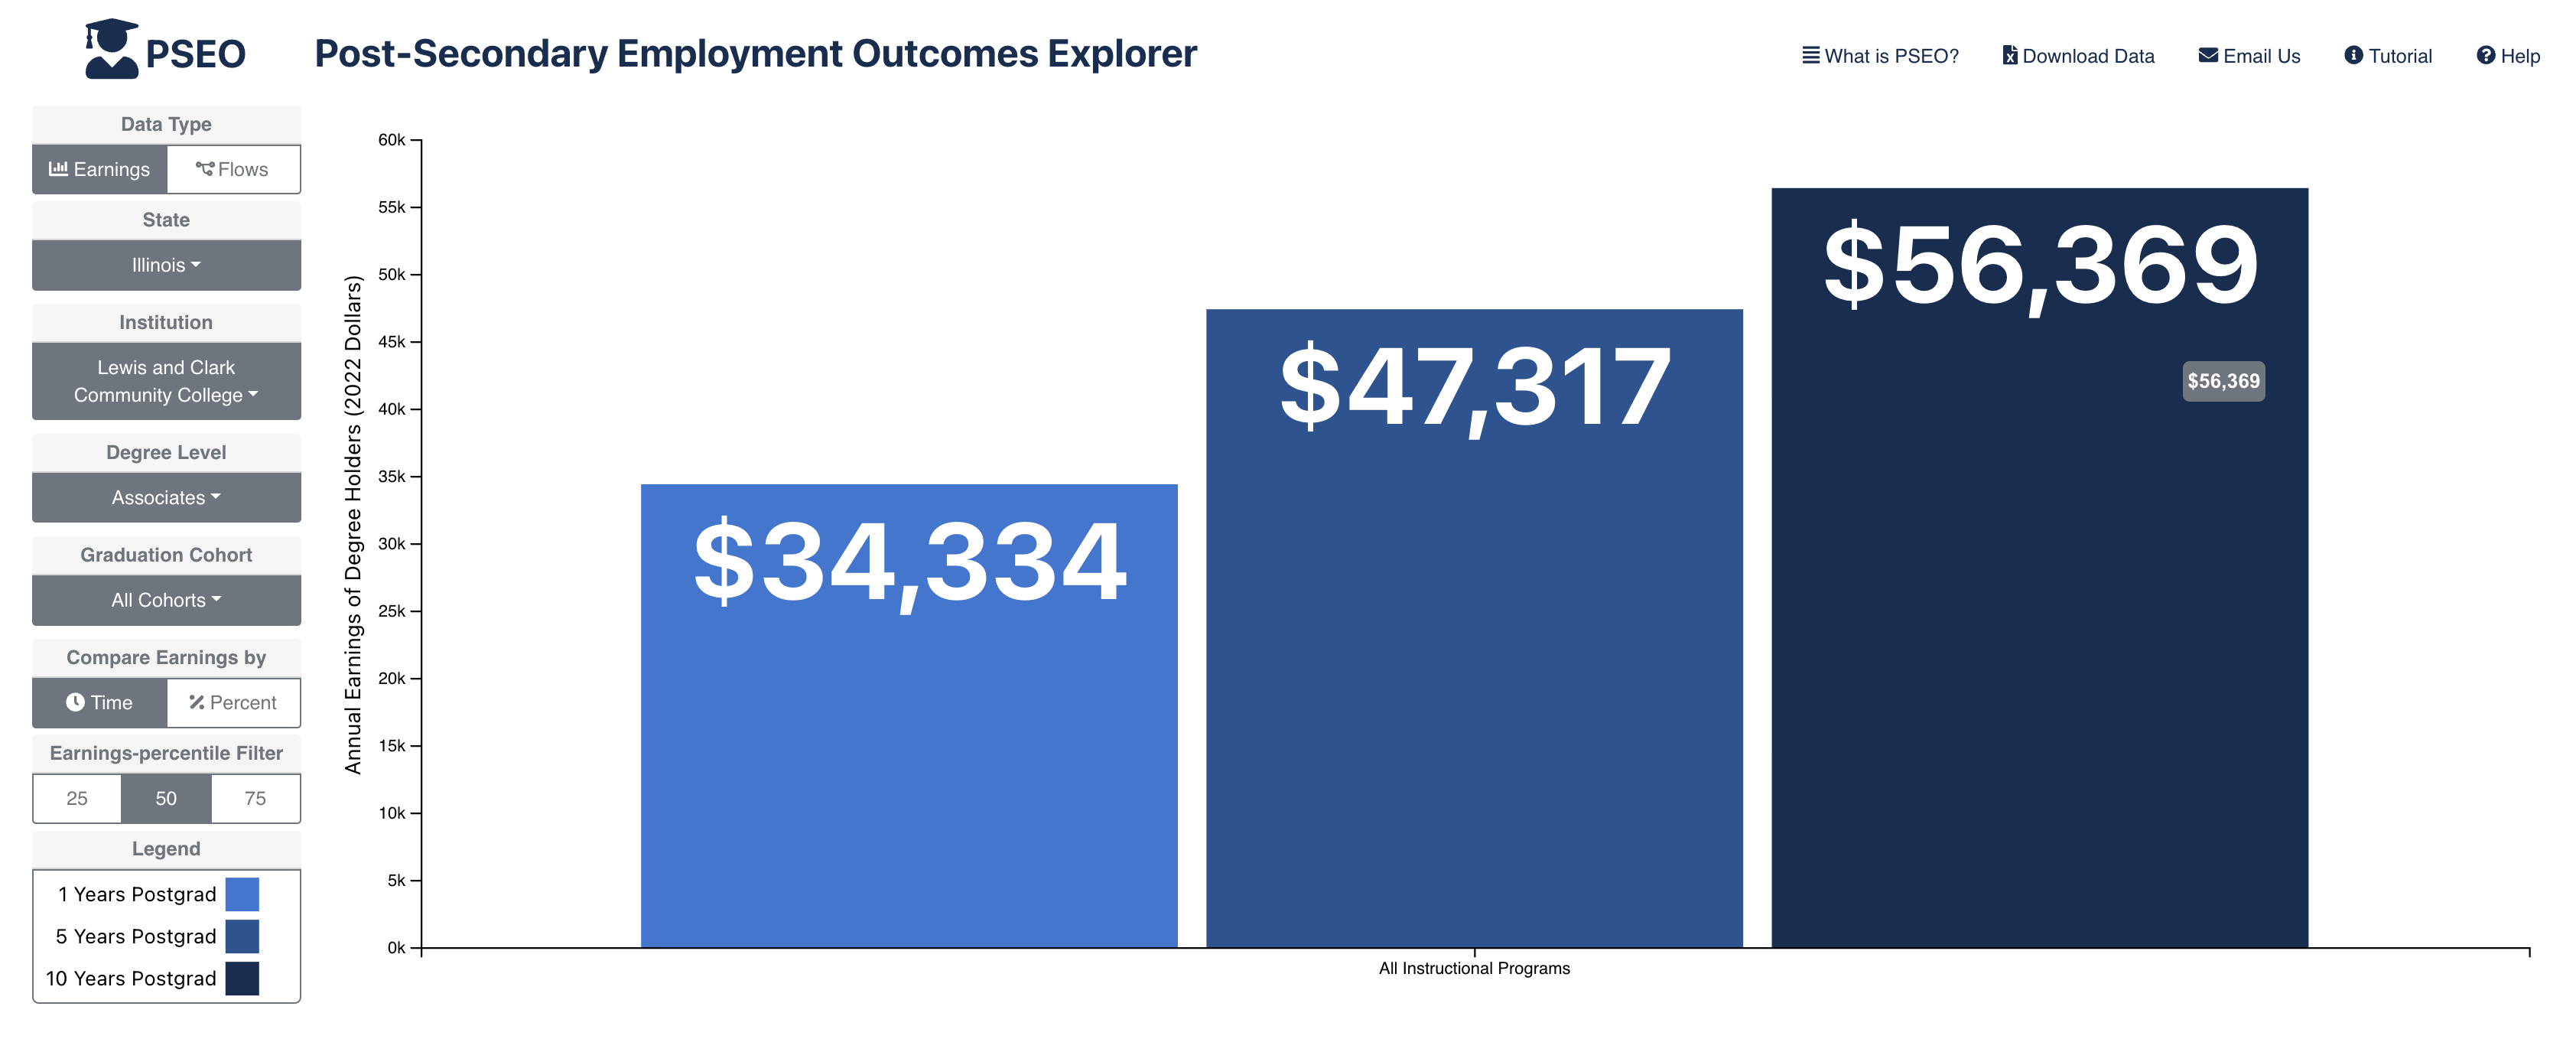
Source: Post-Secondary Employment Outcomes Explorer (The United States Census Bureau)
Licensure/Certification Pass Rates
- Certified Nurse Assistant (2022) – 94.4%
- Dental Assisting (2024) – 92%
- Dental Hygiene (2024) – 100% (Clinical), 94% (National Board)
- Emergency Medical Technician (2025) – 62%
- Nursing (2024) – 93%
- Occupational Therapy Assistant (2024) – 82%
- Paramedicine (2020) – 85.7% (Cognitive) & 100% (Psychomotor)